Pages

Saturday 28 January 2017

M1

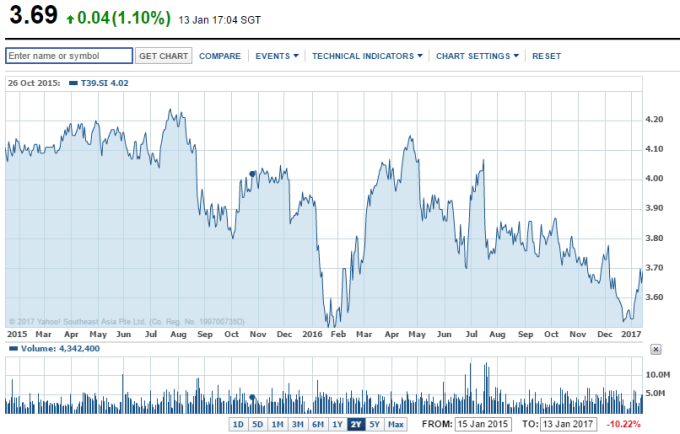
M1 released its 2016 full year earnings with a 16.1% decline to $0.16 per share from $0.19 per share. The market reacted sharply with a 5.5% decline in share price from $2.17 to close at $2.05.

M1 declined 5.5% to close at $2.05 after the earnings were announced 

Attractive dividend yield?
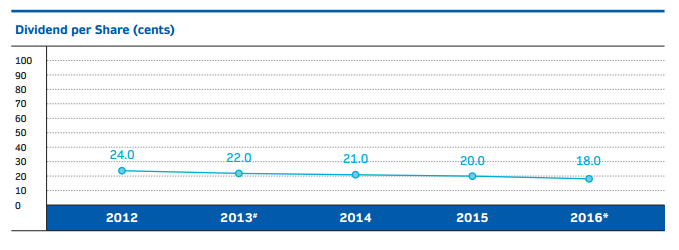
Dividends decreased in line with earnings. 2016 full dividend of $0.129 was 15.7% correspondingly lower than 2015 final dividend of $0.153. Payout ratio was maintained 80.5%, in line with M1's dividend policy. At current price of $2.05, this works out to a dividend yield of 6.3% which is pretty decent for a blue-chip. The big question here is the sustainability of the the earnings (and hence, the dividends). To understand this, let's understand what's driving the decline and the nature of the driver (whether it is permanent or temporary).

FY16 full year dividends declined in line with full year earnings

Source of earnings decline
The decline in full year earnings was $28.8 m (from $178.5 m to $149.9 m). 

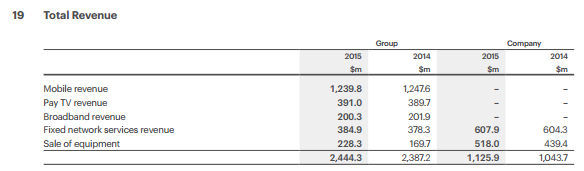
In M1's presentation slides, Handset Sales Revenue was shown to have declined a staggering 23.7% or $80 m. Given that Handset Sales made up more than 30% of Total Revenue, it may be intuitive to attribute the entire decline in earnings to Handset Sales, which are discretionary consumer purchases.

This appears to be supported by the fact that core recurring Service Revenue remains intact. Since the decline in earnings appears to be temporary, then this would look like an attractive buy given the yield, right? Not necessarily.

It is intuitive to attribute earnings decline to Handset Sales given the heavy weighting of Handset Sales

Temporary earnings decline?
The decline in Handset Revenue was offset by a corresponding 17.9% decline in Handset Cost of Sales of $75 m. This means that the decline in Handset Sales actually contributed to only $5 m out of the $28.8 m decline in earnings. Where is the remaining $23.8 m decline in earnings coming from?

Decrease in Handset Sales accompanied by decrease in Handset Costs; Increase in cost of fixed services by $7 m

Higher recurring expenses
$7 m comes from the increase in costs from providing fixed services (see above chart), $9 m comes from the increase in depreciation & amortisation expenses, while $4 m comes from increase in Facilities expenses. All of these expenses are recurring in nature. 


Depreciation & amortisation expenses increased $9 m; Facilities expenses increased $4 m

Future outlook
To summarise, 70% (or $20 m ) of the $28.8 m decrease in earnings appears to be from higher recurring costs which are here to stay. It is unlikely that earnings would increase as a result of reversal of these costs. 

In this writer's opinion, higher core recurring Service Revenue to improve earnings appears unlikely due to stable market dynamics and potential market share disruption from the entrance of 4th telco. Higher capex and investments in infrastructure to explore future opportunities as outlined by M1's future strategy is likely to increase recurring costs and further erode earnings (and hence dividends). 

Expect higher investments and capex as part of M1's strategy

Investors looking to lock in the 6.3% dividend yield at the current price of $2.05 may have to brace themselves for more to come. 


Saturday 14 January 2017

High Dividend Gemstones - Gems or Stones?

Looking to find the highest dividend yielding stock on the SGX? 

The SGX portal allows users to filter and sort all counters based on dividend yield, amongst other criteria. This can be accessed by clicking on the Company Information button from the Main Page. 

Click on "Company Information" to access the Filter

The dividend filter is exceptionally useful for dividend players who can now see the highest dividend yield stock at a glance, at a simple click of the filter.


With returns like this, what are we waiting for. Intuitively one would go for the counter with the highest yield. But not all high dividend yield counters you see are Gems. Some are stones beneath the surface. How would you distinguish the gems from the stones?

This writer focuses on the sustainability of the dividends which gives the counter the dividend yield we see. Underpinning the sustainability are quantitative factors such as earnings trend, gearing and payout ratio, as well as qualitative factors such as nature of business, potential disruptive factors, and the company's position within its market.

Quantitative factors
a. Earnings trend: Since dividends are paid out of earnings, a downward earnings trend can mean lower dividends in the future. 

b. Gearing: High gearing means higher interest costs and lower earnings (hence lower dividends) in a rising interest environment 

c. Payout ratio: If dividends paid > earnings, this is unlikely to be sustainable. Much less so, if the company is paying dividends out of a loss. 

Qualitative factors
d. Nature of business: Cyclical industries (e.g. commodities and shipping) face earnings upswings and downswings.  

e. Potential disruptive factors: Innovation and technology in recent years have disrupted traditional industries,. Consider impact of the following: i.) Uber/Grab on taxi providers like ComfortDeelgro, ii.) Online news on SPH, iii.) E-commerce on traditional retail outlets

f. Company's position within market: High barriers of entry with few competitors is likely to protect earnings e.g telecoms


What are some of the factors you look at when deciding on what to invest? Leave a comment below.

SPH

SPH released its 2017 Q1 results with earnings 43.8% lower than compared to the same period last year. The magnitude of decline should raise alarm on the future profitability and sustainability of its business. 
q1-results
Net Profit Declined by 43.8% Q-o-Q
Core Business Revenue
Excluding one-time charges related to the impairment and provisions of its investments, operating profit would have still declined by 12.4%. The decline in earnings is driven by a decline in the Media business segment which makes up 75% of total earnings based on 2015 AR. 
revenue-segment
Decline in earnings mainly from Media Segment

revenue-segment-2
Media Segment makes up 75% of Total Revenue
Cause for concern?
Disruptions in the traditional news media industry has been giving SPH a run on its money. SPH customers now can access news on a global level from multiple sources. Being the sole local news provider may have allowed SPH to defend the decline of the Media business. But for how long? Readership decline has accelerated in recent years which affects circulation and advertisement revenue.
readership-trends
Readership decline has accelerated in recent years
Response to disruption - Investments
SPH is adapting to the disruptions. Significant investments have been made in digital businesses (e.g. STJobs, STCars.sg, ShareInvestor etc.) and startups to be part of that disruption. But competition in digital business is fierce with most burning cash, making losses and are not be viable until these businesses reach a sizable user base. And startups carry higher risks than most investments. 
asset-composition
More than $1 billion of assets (approx 20% of total assets) in Investments
Impairment issues
Most of the investments are in Available-for-sale Equity Securities which are not publicly traded and involve complex valuation techniques. Changes in its value are presented in a separate "Other Comprehensive Income" section not together with normal earnings, and is rarely discussed. This presents impairment risks and issues similar to the one-time impairment charge experienced this quarter. If we factor in fair value losses of these investments, SPH would be in a loss position. Which begs the question - are we only scratching the surface?
oci
Silver Lining?
There is a silver lining though. Earnings from the Property Rental and Other segments are showing growth. However, these make up only 25% of  Operating Revenue. Furthermore, investment in property to increase share of revenue for Property Rental is highly capital intensive and may not be a viable option - see assets balance sheet above.
Price Performance
SPH is 10% below its peak and at one of its multi-year low - perhaps a result of the threat to its core business - but is the decline over?
price-performance
SPH is 10% below its peak
Dividends Sustainability
The big question is - are the dividends sustainable? 
SPH has been a favorite among dividend players owing to its blue-chip status and sizable nominal dividend payments. In recent years, however, dividend payments have declined and the Company finds itself paying more dividends than it earns.
dividend-history
Dividends have been declining over the L5Y
dividend-payout-ratio
SPH is increasingly paying out more than it earns
This writer feels that it may be time to re-evaluate one's position if you are pursuing a dividend strategy on this counter. What do you think?
sph-logo
*By reading this article, you have agreed that the writer will not be accountable or liable for any investment decisions made in relation this article.


Starhub

At $3.03, Starhub is 32% off its 2015 peak and at its multi-year lows.
starhub
At $3.03, Starhub is more than 30% off its 2015 peak
Dividend History
Starhub boasts of a stable dividend distribution history of $0.05 per quarter or $0.20 per year. At $3.03, this translates to a dividend yield of 6.6%. Regular distributions provide investors with cash flow relief.
starhub-divend-history
Starhub boasts of a regular and consistent dividend history of $0.05 per quarter or $0.20 per year
Earnings
Are the dividends sustainable? Starhub pays out a substantial portion of its earnings (more than 90% of its earnings). Earnings per share have been in the range of $0.21 per year. It is reasonable to assume that as long as Earnings per share stay above $0.20, investors should continue to enjoy $0.20 per share of dividend each year. In a mature telecommunications market such as Singapore’s where competition dynamics have stabilised over the years, earnings upside would  be limited. Shareholders should not expect an improvement in dividend distributions. The question is whether earnings are sustainable.
starhub-eps
As long as EPS stays above $0.20 we should expect $0.20 DPS
TPG Telecom – The New Entrant
The conclusion of the spectrum auction marks the entrance of the 4th telco (TPG telecom) and a shift in the competition dynamics of the local telecommunications market, which is bound to erode the market share of the existing telcos and put a dent to their earnings. Talks for the introduction of a 4th telco have been out for awhile and the stock market reacted accordingly. Share prices of Singtel and M1 declined in varying extents depending on market perceptions of their earnings exposure to the local market soon to be disrupted.
Starhub’s position
But TPG telecom is expected to offer only mobile services based on the spectrum awarded, which accounts for 50% of Starhub’s revenue based on 2015 AR. With bundling packages offering savings on other services like Broadband and Cable TV, TPG Telecom can expect Hubbers to have a tough time forgoing these savings for TPG mobile plans. Furthermore, any mobile plans offered by TPG will be met with a counter-response from existing telcos to defend their market shares such as the introduction of SIM-only plans – a strategy used by TPG in its dominant Australian market. M1’s earnings appears to be in a more vulnerable position in the writer’s opinion.
revenue-segment
Starhub Non-mobile revenue accounts for 50% of Total Revenue
Has the market over-reacted to the introduction of the 4th telco? Is now a good time to pick up a blue-chip at its multi-year low to lock in a dividend yield of  some 7%? Is the yield sustainable? Feel free to share your thoughts.
starhub-logo
*By reading this article, you have agreed that the writer will not be accountable or liable for any investment decisions made in relation this article.